

It’s a well-known fact social media has become one of the major marketing platforms in the world. But from all social media platforms, Instagram seems to be the one most people focus on. No doubt it’s because people have researched well enough and found that they get the most audience reach and engagement from this app.
Knowing how to use an app and all its tools to its full potential is a very helpful skill to have. As the companies of the world started relying on social media more and more for marketing, app developers had to create and launch marketing tools to accommodate what was needed.
If you’re like me and you think you’re afraid of terms like reach, engagement, and insights, I’m here to tell you that you needn’t be afraid anymore. Once you see your own data fill up in the numerous little sections and tabs, you’ll feel so much better and will also understand how to make more informed decisions when planning your social media strategy.
Instagram Business account
Are you ready to finally take that leap and learn about Instagram Insights?
It’s now or never, so let’s go!
First things first. You must make sure your account is a Professional — Business account. It’s very easy to do this, I’ll share some quick conversion steps here.
– Check if your account is a public account. If it’s private, quickly change it to public using these steps — Profile > Hamburger menu on the top right > Settings > Privacy > Switch the toggle at the top to Public.
– The next step is almost similar to the previous one. Profile > Hamburger menu on the top right > Settings > Account > Switch to Professional (at the bottom)
– The app will have you select a tag that best describes the purpose of the account. It will give you some commonly used suggestions, but you can also use the search bar to look for something more specific.
– In the next step, you need to choose between Business and Creator. (The examples I’ll be using further in the article are of a Business account)
– Next, you’ll have to provide contact details like an email address and phone number.
– After that, one of the most important steps is to connect to Facebook. You must have a business page to connect to this account.
– Enter the credentials and select the Facebook Page to link to Instagram. And Voila!
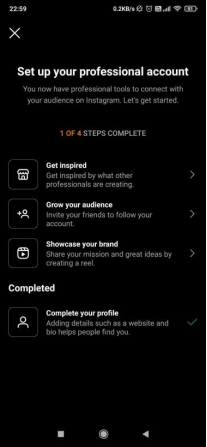
To make sure new users have some knowledge on how to grow and maintain a successful business account, they’ve added a few more steps in the process to complete the switch to business, which can be done later.
Insights
Now that we’re a business account, let’s dive into the insights.
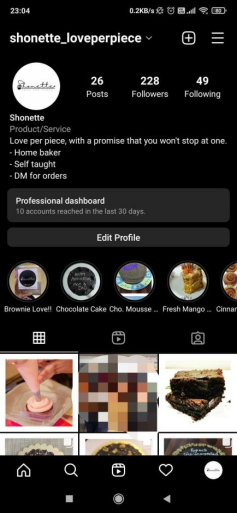
On the profile page, under the bio, you’ll see a tab ‘Professional Dashboard’ with a small detail about your reach in the last 30 days. Once you click on it, the dashboard here gives you a brief of the number of accounts reached in the last 30 days. It also shows a bar graph to distinguish between followers and non-followers.

What you need to do from here is click on ‘See All’ from the top right corner of the dashboard. This page gives you an overview of the number of accounts reached, the number of accounts that engaged, and your total followers. This is the page from where you’ll be able to navigate to all those yummy insights that will help you strategize.
You can select time frames like the last 7 days, 14 days, 30 days, the previous month, and the last 90 days. You can also select custom dates within a window of the last 90 days.
However, demographic data cannot be fetched for customer dates.
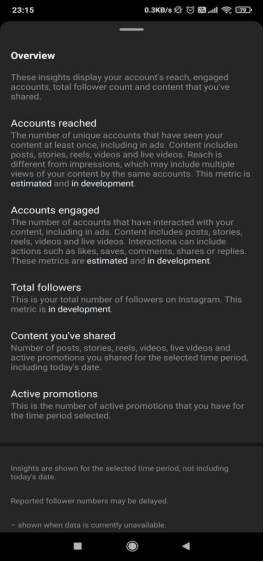
The little ‘i’ on the top right gives you a small explanation of each of the metrics covered in this dashboard.
Let’s take a look at these in order now.
1. Accounts reached
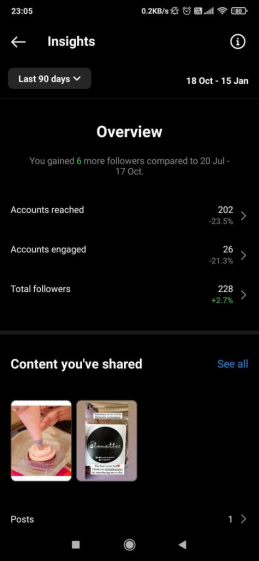
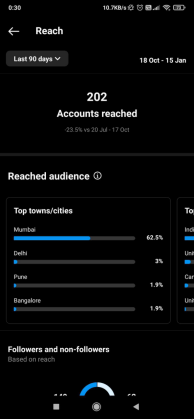
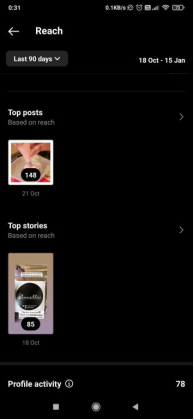
At the top of this page, you’ll see the number of accounts you’ve reached in the selected time frame. It also indicates the % of increase or decrease in the number as compared to the previous time frame of the same duration. For example, the 1st image below has the selected time of the last 90 days 18 Oct to 15 Jan. The 90 days prior to this will be 20 July to 17 Oct.
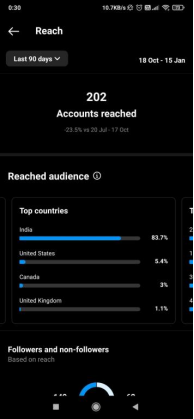
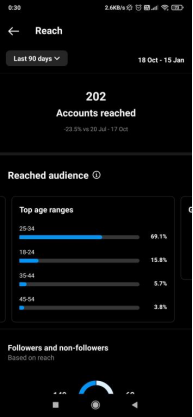
Below that, you can see the demographics data. It shows the top towns/cities you’ve reached, the top countries, the top age ranges, and a gender breakdown.
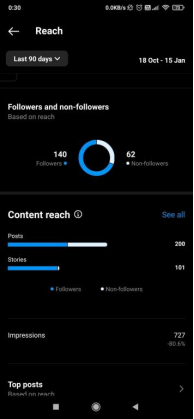
The next segment shows a break up of the number of follower accounts and non-follower accounts you’ve reached.
You can then see your content reach based on posts, stories, videos, reels, etc. your top posts, stories, reels, or videos based on the reach data.
You can also see your impressions in that time frame. Impressions are the total number of times your posts, stories, or reels have been viewed, liked, commented on, etc. It does not consider whether the user is the same or not, it counts everything!
Toward the end of the page, you’ll find your profile activity. This shows you the total number of profile visits, and it tracks the number of times your email, business address, or any other CTA button was tapped.
* This data can help you edit and mold your content so that it reaches your target audience. For example, if your target audience is female, and your data shows you’ve reached more male accounts, you know you have to change your content and creatives and strategize accordingly to reach more female audiences.

2. Accounts engaged
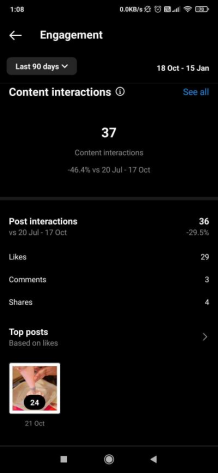
At the top of this page, you’ll see the number of accounts engaged in the selected time frame and also the percentage of increase or decrease from the previous time frame. It gives you the break up of the number of follower accounts and non-follower accounts that have engaged with your content.
You can get demographic data if more than 100 individual accounts have engaged with your content within the selected time frame. The parameters will be similar to what you see under Accounts Reached.
You can see your total content interactions on your posts, stories, reels, and videos combined. Or you can select each type of content and get more in-depth data for each post, story, video, or reel along with the top post in each category. An overview will be displayed to show the total number of shares, likes, and comments in each category.
* This data helps you understand whether or not you need more engaging data or CTA buttons on your posts, stories, reels, or videos.


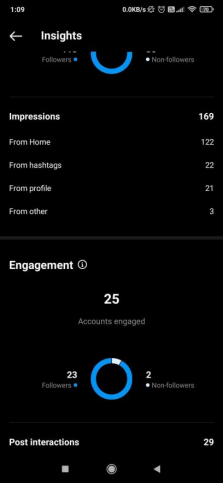
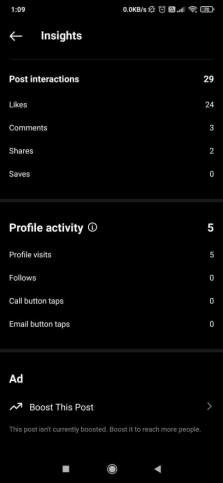
For example, if you select a post under Post Interactions, it will open another Insights page for that post in particular. You’ll be able to see how many accounts liked the posts, commented on them, shared them, and saved them. There’ll also be an overview of the number of accounts that the post reached, how many engaged with it, and profile activity.
You can see the number of follower accounts and non-follower accounts that you reached and have engaged with the post.
You can also see the number of impressions. This is divided into impressions that have come from the home page, from the profile page, from hashtags, and others.
The post activity and profile activity are further broken down toward the end of the page.

The insights you see when you click on the top posts of other categories can differ.
For example, if you select a top story, you won’t get data like saves or comments.
This insight page will give you an overview of the number of accounts that story reached, how many engaged with it, and profile activity.
You get the break up of follower accounts and non-follower accounts that your story reached and also the number of impressions on that particular story.
The next segment has the engagement details like story interactions and navigation. Story interactions tell you how many accounts replied to that story and how many shared the story.
Navigation tells you how many times the story went organically to the next slide, how many exited on that slide, how many tapped into the next story, and how many went back to the previous story.
Toward the end of the page, you have your profile activity including profile visits.


3. Total followers
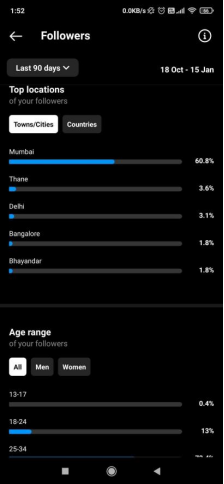
The last metric in your Instagram Insights is your Total followers. This page gives you the total number of followers you gained in the selected time frame.
You can see your overall growth and also the number of follows and unfollows. There is also a bar graph representing these numbers for a more visual understanding.
You can then see the
1. Top locations of your followers with a city or country filter.
2. Age ranges of all your followers, or you can filter the age range based on male and female followers.
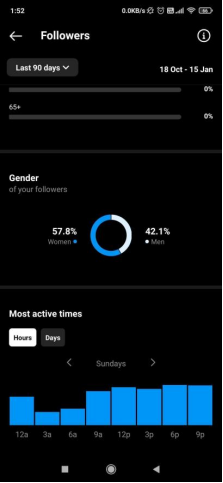
3. Total percentage of your male and female followers in the next segment.
The last segment shows your most active times. You can see the most active hours each day by changing the days using the navigational arrows. Or you can select the ‘Days’ filter and see your most active days. This helps you understand when the best time is to post your content in order to get high reach and engagement.
Bonus:
Crowdfire is a social media management app where you can schedule your content to be published automatically at the best time. The app calculates the best time based on the engagement you receive and the most active times of your audience.

That’s all folks!
How has Instagram Insights helped you improve your business?
Let me know in the comments below. 🙂