

Dropping the perfectly curated infographic on the right social platform could feel like a Christmas miracle or as if a magic wand was waved on your post engagement analytics ✨
Infographics help to share a lot of information in a short amount of time in a fun manner. The colour schemes, fonts, animation, and the fact that there are few frames and little to read but more to understand make it a great way to communicate with your audience.
From here on, you will be understanding –
1. The prerequisite of creating infographics.
2. Tips + steps to create infographics.
3. Tools that will help you create infographics.
The To-do before you start designing your infographic
Pick a topic & Research
Nothing is better than a well-researched piece of information. So, the first step is to pick a topic, collect information, a lot of something that you would like to put together as an infographic.
Understand your audience and the platform you’re publishing
When you have enough data, the next step is to define your audience and the platform they use the most.
Once you have that figured out, it’s easier to choose the post dimension and the type of content that you could weave together.
So, if your audience is mostly on Instagram, you could choose the squares for the feed and 9:16 frame for an Instagram story!
Pick a purpose
It’s one of the most important steps as it defines the goal of creating and putting out this infographic.
You can pick this purpose by asking yourself questions such as-
- Why am I creating this infographic?
- What is the time my audience is most active?
- Is this piece of information valuable?
- What is it going to convey/educate or inform the viewer?
Steps to create Infographics
Fact check
Once you have a purpose for creating the infographic and enough data around it, the first step to creating an infographic is to ensure you fact-check all the information you’ve collected and filter the unwanted bit of it, replace all the jargon, and rearrange the data for better readability.
The last thing you’d want is outdated or partly incorrect information in your infographic.
With how quickly things have been changing, it’s easy to miss out on updated information or add something that may make you or your business seem dishonest.
Write a copy
Once done with the fact check, the next thing to do is write a copy.
This could be slightly different than other content writing as the trick is to think ahead and consider that the text will be separated into sections and you’ve got to set a tone for the content that resonates best with your audience.
Visualization (Pen to paper)
The next step is to chart the content and make a rough sketch of how the infographic should look like.
This gives you better clarity of the number of sections, questions, pointers, and where it could be placed.
Some infographics would need you to sketch a flow chart, timeline, How-To, or tree diagram wireframe.
Pick a tool
The last and most important step is picking a tool and putting your ideas from physical paper to digital paper. For this, there are several tools available but picking the right one would be tricky.
Once you’ve figured the tool, things automagically fall in place as there are hundreds of templates to choose from to make those stunning infographics.
Tools to create infographics (even if you’re a beginner)
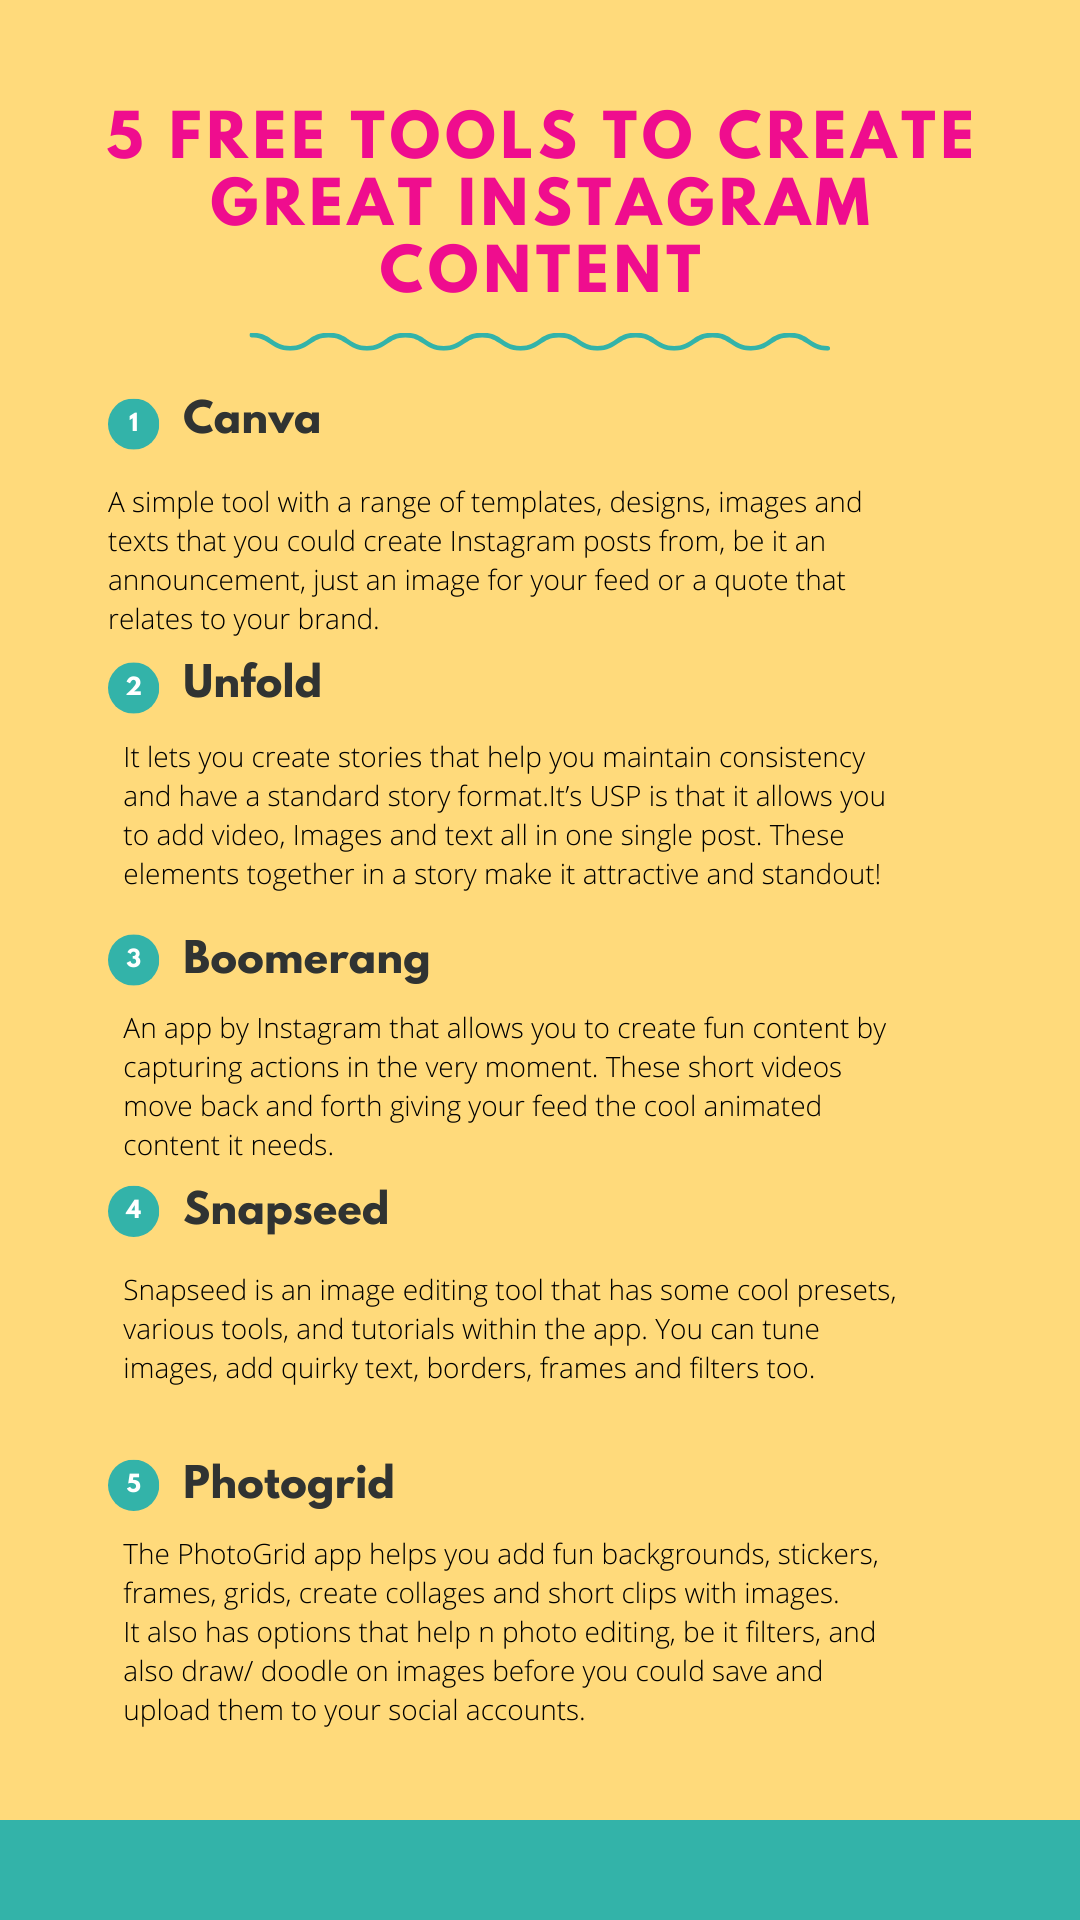
1. Canva -It’s one tool that you can count on for simple templates where you could replace text, add elements, manage the colour scheme, set the right tone, save, and you’re done!
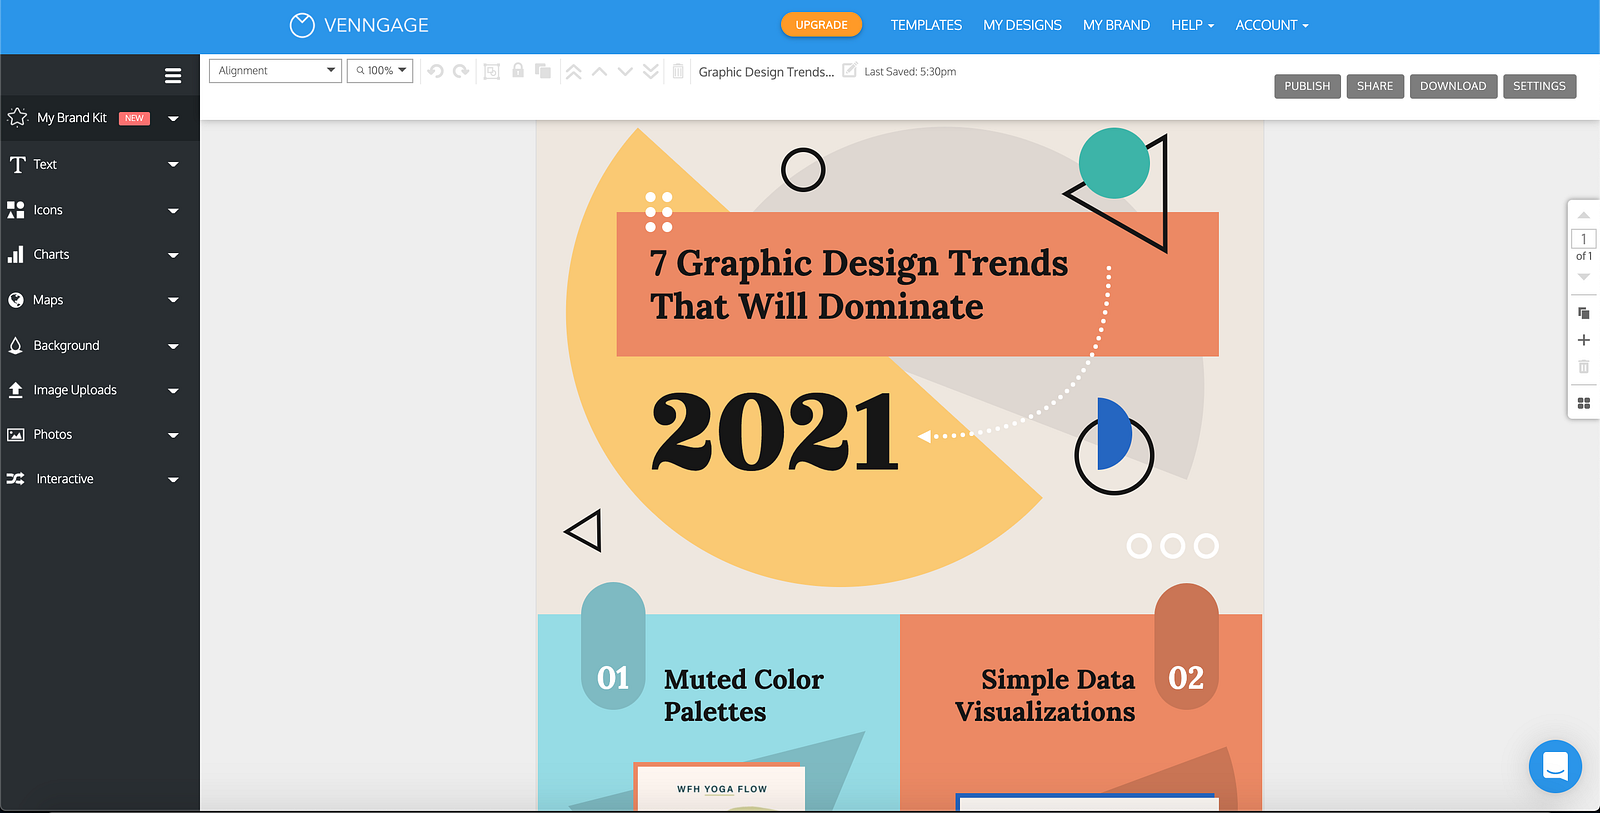
2. Venngage–This tool helps you create memorable infographics. It’s super ideal to create statistical infographics via Venngage. The best part about this tool is you get a hang of it while just dabbling around with for a bit. Here’s a step-by-step guide to creating infographics on Venngage.
Also, it’s easier because of the templates available include Line Chart, Pie Chart, Bar Chart, Scatter Plot Chart, etc.
3. Snappa-This tool claims to maximize social shares. This is because all the visual elements are well-proportioned as per the social platforms that you’d be publishing too, the text elements are balanced, and the colours complement one another in the templates you pick.

4. Infogram-This tool is the fastest way to create interactive and responsive data visualizations, it also helps to create detailed charts, online reports, and interactive maps.

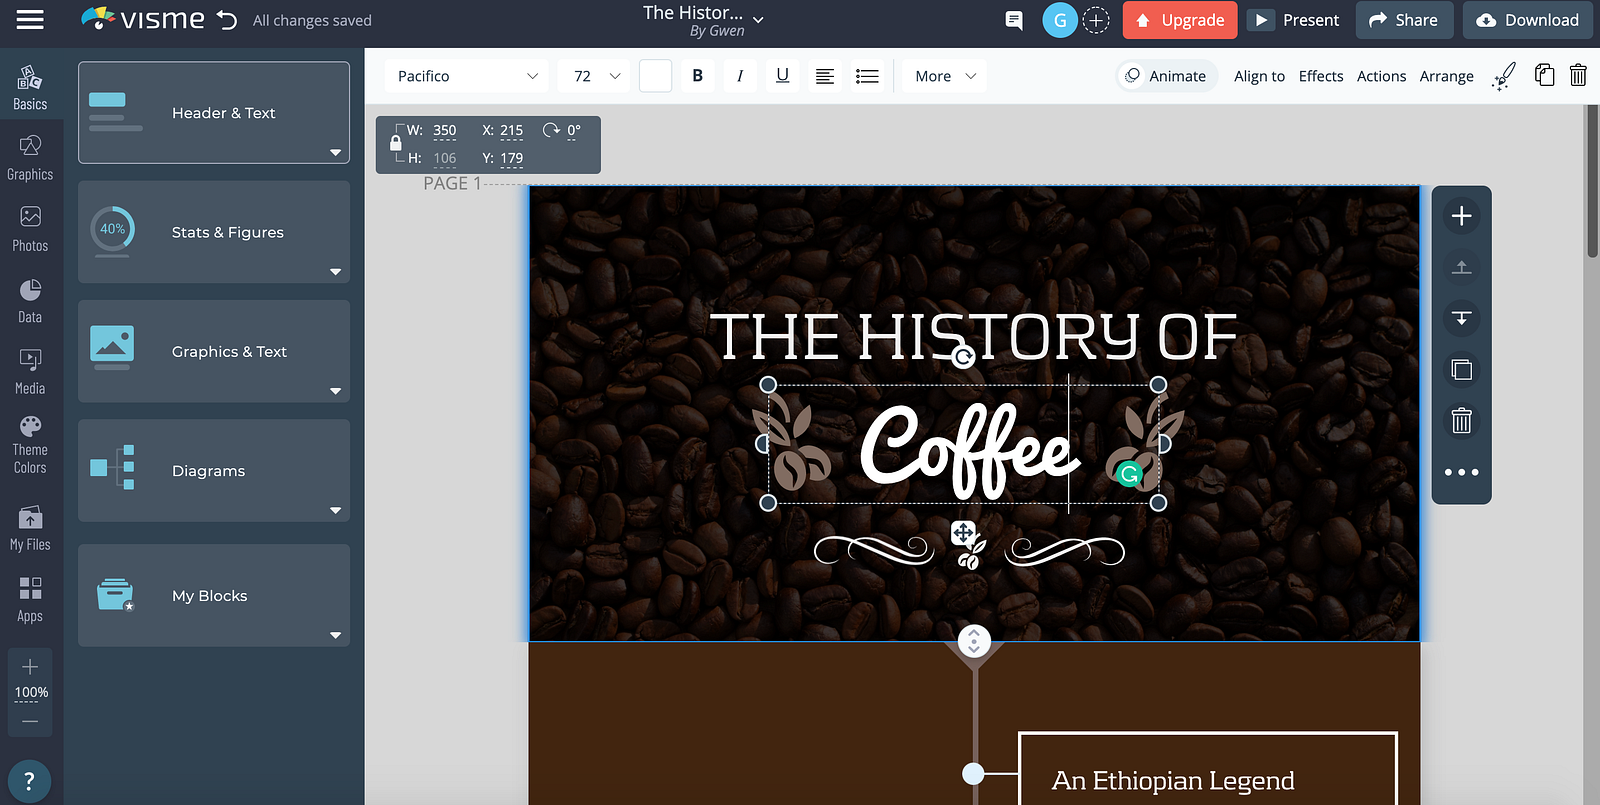
5. Visme-This tool helps you to create infographics that use striking, engaging visuals to communicate information quickly and clearly. You can also create videos and reports using Visme.
Proof Read & Publish
Now that we have the infographic ready, it’s always a good idea to proofread the content before scheduling them to your social accounts.
Also, If you’d like these infographics to go out on a particular date/ time it’s suggested to use a social media tool to schedule posts in advance.
Bonus (Tips)
A few things to keep in mind-
- Ensure the infographic has a crisp headline.
- Place the content in blocks & charts without it being too crowded.
- Avoid excess graphics and overloading them with text.
- Don’t miss on branding.
That’s all Folks! 🙌
With Crowdfire, you can find curated content, schedule your posts, engage with your audience, deep-dive into analytics and create custom reports. Try it for free.
One comment