

Infographics are an amazing tool to share information, attract attention, and keep the denizens of the internet hooked to your content.
But creating infographics can be a challenge for marketers and small businesses.
There are numerous sections that need to be incorporated in an infographic, and the amount of time needed to make them from scratch can be prohibitive.
At Venngage, we know this, which is why we’ve made creating infographics for your marketing that much easier.
Venngage offers a host of customizable infographic templates, among other design templates that you can use for your visual content marketing.
In this guide, we will outline the steps you need to follow to create an infographic on Venngage. We will also explain when to use infographics in your marketing.
Please note, you need to create an account on Venngage to customize templates and to download your completed visuals.
Types of Infographics
Before we continue with our guide, we want to mention the types of infographics Venngage has, which will make it easier for you to decide what you can use and why.
These are the most popular kinds of infographic templates Venngage has on offer at the moment.
Informational Infographics – The most common and popular kind of infographic that is information and text-forward.
Statistical Infographics – These kinds of templates are excellent for data visualization, and tend to put the emphasis on numbers over text.
Process Infographics – To detail a process or steps of a system, you can use a process infographic that has distinct sections and subsections.
Geographic Infographics – For data that needs to be broken down by location, geographical or map-based infographic templates can be used.
Timeline Infographics – Visualize the changes or history of an industry or event in a neat and clean timeline infographic.
Comparison Infographics – Ideal for making comparisons between two or more products, services, or options.
List Infographics – People love lists, and a list infographic template makes a standard text list more visually appealing.
Venngage also categorizes infographics for Fun Data—pop culture-related content—as well as infographics for sectors such as nonprofits, human resources, and real estate.
How to Create an Infographic
Now that you know the kind of infographic templates on offer from Venngage, you can choose the one that works for you and start customizing it.
Below are the steps you need to follow.
Step 1: Compile Your Headings
When you visit the templates page on Venngage, you will pick a template that suits the message you want to share. The screen looks like the below:
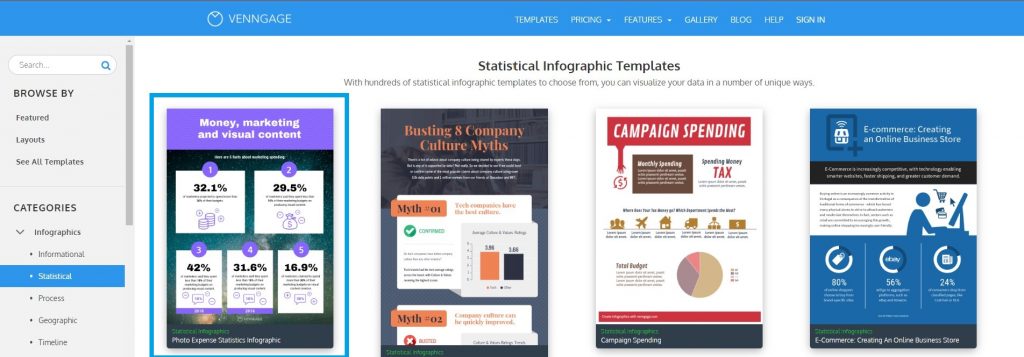
As you will see, most infographics are divided into sections. It is important to have headings for these sections to improve readability.
Aside from the primary heading that outlines the story of the infographic, you need to have subheadings, and section dividers.
You can see in the below example how there is one main heading, and how the different sections are divided by headers, with a block of text under each explaining further.
![]()
These headings, subheadings, and section dividers need to be outlined well before you choose a template.
For instance, the above example doesn’t have subheadings. If you needed one, you would have to insert it somehow.
Instead, if you have already planned the outline of your infographic, you will be better positioned to choose wisely and simply swap out text as and when you need to.
Step 2: Choose Data Visualizations
Whether you have a data-driven outline for your infographic or not, you should be thinking about how to incorporate the use of numbers in your infographic.
Numbers of any kind will make it easier to absorb information and will improve the flow of information, as you can see in the below infographic example.
![]()
But you may have more complex data, in which case, you need to pick charts and graphs that best share your information—Venngage has a host of chart templates that you can use.
Note how the below infographic combines a number of different chart types to share information about smartphone preferences.

You can use pie charts, graphs, area charts, scatterplots, word clouds, and bubble charts to explain a variety of information within a single visual.
But remember not to be too diverse in your chart use. While there are plenty of options, if you can illuminate separate sets of data using a similar chart, stick to it.
It can be fun to play around with lots of tools, but it doesn’t always look good in the finished product. Your infographic needs to legible and cohesive for your audience, after all.
Step 3: Pick Your Icons
Icons are an excellent graphic that evokes emotions and tells a story, often far better than a paragraph of text.
You will already have an outline for your infographic and the data you want to highlight in it. Why not use some icons to draw the eye to the information you are spotlighting?
Look at the infographic below which uses icons that readily explain what the numbers and text are associated with.

When you are working on your infographic template, use icons that enhance the story you’re telling through your visuals.
You can use the replace tool on Venngage to swap out an icon for another in the same spot, like so.
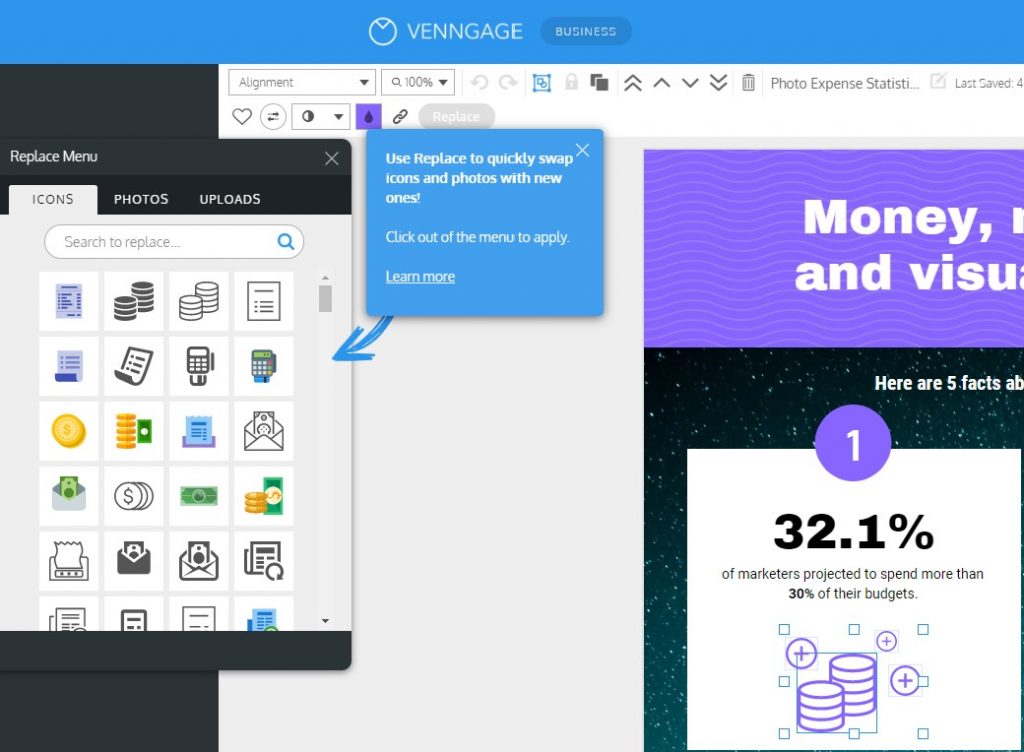
Simply double-click on an icon, and the replacement menu will appear. Type in the kind of icon you are looking for and it will be instantly replaced.
You can do this for all the icons in your infographic so they better share your story.
Step 4: Customize Your Template
Once you’ve included the facts, figures, and icons you need to comprehensively share your information with a reader, you can customize the template to your brand’s needs.
Small business branding is an important component in visual content marketing, and that is why Venngage has a ‘My Brand Kit’ section where you can add your brand fonts, colors, and logos.
These can then be instantly added to any design you create on the platform.
This is what the brand kit option looks like when you upload your brand details to the platform.

You can also change the colors in your visual and fonts in your infographic manually from the sidebar.
Additionally, you can add textures to the background, and use Venngage’s library of stock photos to make your design more engaging. You can upload your own images, as well.
If you have more or less information than the template has, you can resize the template to accommodate the additional, or fewer, elements, like in the below image.

Customizing the infographic will make it look more like your brand’s visual, rather than a template, which will make it more attractive to your target audience.
Step 5: Revise Your Infographic
Before you publish your infographic, you should take one more look at it. Are your icons aligned? Have all the data points been covered? Are your fonts consistent?
Sometimes when you undo something, other elements could have been moved, or a random movement of a trackpad may have moved an element out of place.
Revising your infographic will ensure that everything is in place and intact for you to share it with the world.
When Should You Use Infographics?
Now that you know how to create infographics, when should you use them?
With a tool like Venngage at your disposal, it can be tempting to use infographics whenever and wherever you can. But that would not be the best use of this tool.
Overusing infographics—especially when your message doesn’t need to be very fleshed out—could lead to a loss in interest in your brand’s marketing.
However, there are a number of areas where you can use infographics for startling effect. Here are some of those areas.
To Share Large Sets of Data
A large amount of data can be hard for a reader to consume and understand. Which is where a statistical or informational infographic comes in handy.
These infographics break down your data into visually appealing sections of easily-readable text, numbers, and icons that help people retain what they have seen for longer.
To Tell a Story
Storytelling is a key factor in marketing and an infographic helps you tell stories both textually and visually.
Because of the layout of infographics, the eye knows exactly where to go—whether vertically or horizontally—as if following the pages of a storybook.
As most people are visual learners, this flow makes the reading process that much simpler and more enjoyable, thus improving shareability.
For Link Building
Infographics are an excellent link building and affiliate marketing tool. When reaching out to potential link partners, you can offer customized infographics in exchange for link placements.
Not only does this technique give your link partner great content, but it could also lead to a long lasting partnership.
To Improve SEO
What many people tend to forget is that visuals can help with SEO. While keyword use in blogs, web pages, and product pages is an essential component of SERP, visuals can also help brands rank on Google.
Google’s Image Search has advanced a great deal in the past few years and now, with the right alt-text, captions, and placement, infographics can be found independent of the written content associated with them, thus helping your SEO.
Additionally, according to heat map analysis, people tend to spend more time looking at visuals on a website than text.
By using infographics, you will ensure that people stay on your pages for longer, which Google will use as evidence that your pages are of higher quality than others.
To Repurpose Content
Want to give old content new life? You can repurpose it as an infographic!
Take old blogs and vlogs and condense them into infographics. Headers can be used to divide up the sections, and you can use one key point from each paragraph as your body copy.
You can also divide up an existing infographic into separate social media posts, giving you a wealth of attractive content to share on your platforms.
And you can use infographics for your newsletters or as headers for your email marketing.
The sky’s the limit when it comes to repurposing content with infographics.
Conclusion
Infographics are a great way to liven up your content and to make connections online.
The way that infographics place information and data make them easy to read and attractive for the reader, increasing the chances of the content being absorbed and shared.
There are a number of different infographics and they each have their uses.
But when making an infographic, it is important to plan it in advance and choose your templates according to how well it can share your message, not because of how attractive it is.
Avoid overusing the infographic in your marketing—they will lose their charm and that will negatively impact your visual marketing efforts.
With the guide above and pointers about how and when to use infographics, you should be able to create attractive visuals that will tell your brand story effectively and efficiently.
Ronita Mohan is a content marketer at Venngage, the infographic and design platform. Ronita enjoys writing about anything and everything, but limits herself to digital marketing, pop culture, and the importance of representation.
Twitter: @Venngage
One comment