

The use of social media has gone from a simple picture sharing and small community space to be the most important place to show off and reap your marketing skills.
The only way to use it as a marketing advantage though is if you’re able to analyze and evolve your plans and strategies based on the data you get from your analysis and reports.
While there are many apps and websites that will collate the information for you, it is also good practice to know how to use the tools provided by the platform itself.
Twitter insights are an incredibly powerful tool for marketers and businesses. They can help you understand what your audience wants, identify trends in the industry, and measure the performance of your campaigns.
With Twitter insights, you can gain valuable information about your target market. It’ll help you develop better strategies to reach them, and hone your skills to create more effective campaigns. By using these insights, you can ensure that your marketing campaigns reach their maximum potential and bring greater success to your business.
In light of the recent changes made by Twitter, it’s possible that the app you’ve been using is now unable to provide the same services as before.
In this blog post, I’ll shed some light on what Twitter Insights offers and how to use it so that you don’t find yourself stranded with no idea how to move forward.
Let’s begin.
First things first, this is where you’ll go for Twitter Analytics and Insights – https://analytics.twitter.com/
Once you sign in, you’ll see this dashboard.
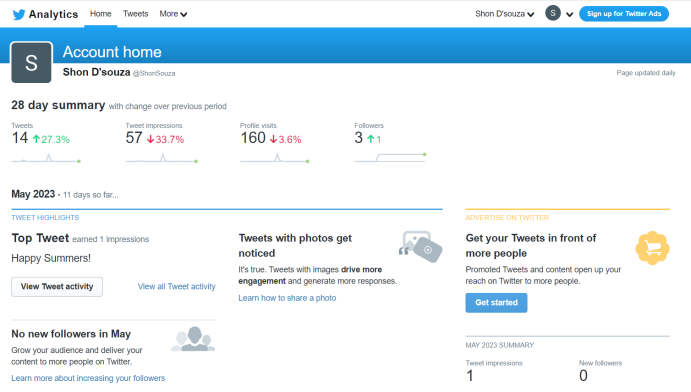
The Home page will show you a 28-day summary of the number of tweets, impressions, profile visits, and followers. After that, you’ll get a month-by-month listing of the tweet highlights, tweet activity, and tweet summary. The summary shows monthly numbers of tweets, tweet impressions, new followers, and profile visits. Tweet Highlights show you the top tweet and the top media tweet.
This page gets updated daily.

Tweet Activity of your top post of the month will show you the number of impressions and engagements. ‘View all Tweet Activity’ will take you to the second page on your dashboard.
The Tweets page will give you a more in-depth look into the insights and analytics. You can opt between various time frames like the last 7 days, last 28 days, monthly (up to 5 months), and then there’s also the option to manually select date to date.
The default here is 28 days and the first thing you’ll see here is a graph of the number of impressions over the last 28 days.

You can also export this data. Here you’ll see 2 options — to export by tweet ad to export by day. Both give you the same information like impressions, engagement, engagement rate, user profile clicks, hashtag click, detail expands, re-tweets, etc. It depends on you if you want it categorized by day or by tweet.
Below the graph, you’ll see another 4 sections, or subsections. Tweets, top tweets, tweets and replies, and promoted tweets.
The four sections basically work as a filter since all 4 give the same information – Impressions, Engagement, and the Engagement Rate for each tweet.
While Instagram and Facebook use post reach in their engagement rate calculations, Twitter uses post impressions instead. The formula is the total number of engagements divided by the post impressions.
Twitter also displays this information for all users, not just Twitter Blue users or verified pages.
You’ll see how the tweets with higher impressions show at the top of the list. These will almost always be tweets that encourage engagement from your audience, like polls, videos, GIFs, and even image posts.
You’ll see that the top post is one with a caption and a link to a video. The one after that has a tag and then there is a thread. Based on this information, I’d work on getting more video posts out.
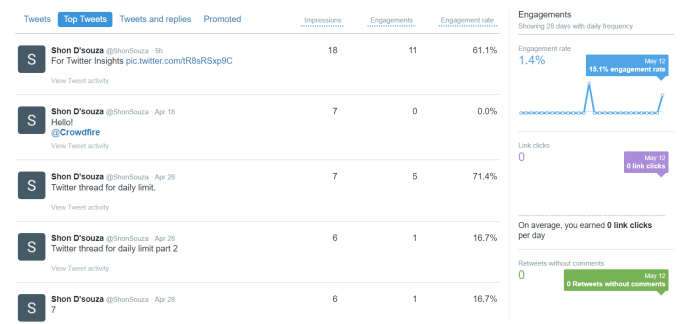
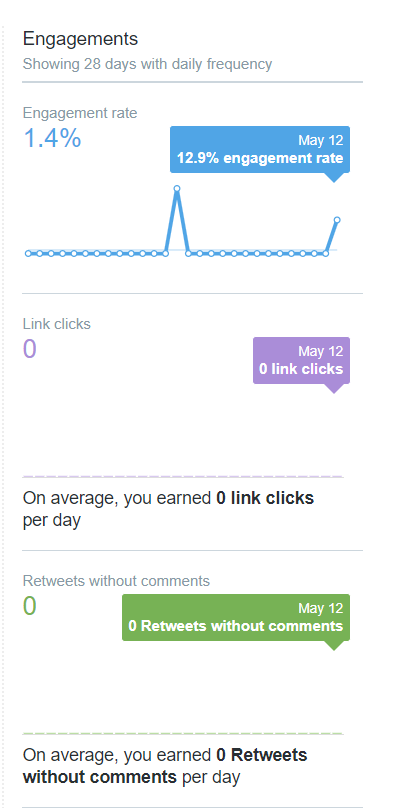
You’ll also see different types of engagement data on the right-hand side.
This column shows graphs of different engagement data. These graphs will help you understand whether your campaign is getting the expected reach and engagement. You’ll see an average of link clicks, and re-tweets without comments, likes, and replies.
If you find that the graph is dipping at any point, you’ll know what needs to be done better.
While this data might look like too much work, or just too daunting to do on your own, all it needs it getting used to. Once you start using it, consistency is key. Keep making notes on what has changed, research possible reasons as to why that might have changed, and then work on creating a better campaign in the future.
If you feel like you need a stepping stone before analyzing data on this tool, you can start by looking at Tweet analytics shown under each tweet of yours. (Highlighted in the image below)

For this video post, for example, you’ll see the number of likes, retweets, and comments. You’ll also get impressions, engagements, detail expands, new followers, and profile visits. This is, of course, is only possible for single tweets. You will not be able to see the bigger picture here and compare it with other tweets.
On scrolling, you’ll see the number of views and unique views. Unique views are the number of new users that view your video while just views give you the number of times the video was viewed irrespective of repeat views.
There are also stats for audience retention on video posts. Audience retention is the percentage of viewers that have watched a video up to a given time. According to the image below, 100% of viewers have watched until the 3rd second of the video. 50% watched until the 4th second and 50% until the 5th second.
This data will help you understand if you need to change something in your videos. You can play around with video size, length, content, etc., and see what gets you the most engagement.


Constantly changing the kind of content you post has its perks. As you go along trying different things, you’ll understand what captures your audience’s attention the most. If you go step by step, you’ll be able to easily plan out your campaigns.
First find out if you get the most engagement on videos, images, text tweets, GIFs, etc. Then find out the kind of content you should focus on, in other words, content pillars – educational, promotional, entertainment, community, and engagement.
Although all 5 are important, you can prioritize them based on your engagement and reach. Once all this is sorted out, the only thing left is to keep up with time and trends!
Twitter is a powerful platform for marketers to reach their target audience and engage with them. With the right insights, marketers can create campaigns that will help them increase their reach and engagement.
By understanding the different metrics such as impressions, engagement, and target audience, marketers can craft campaigns that will help them maximize their Twitter presence. With the right skills and knowledge of how to use Twitter effectively, marketers can create campaigns that will help them achieve their desired goals.
That’s all folks!