

Social media platforms are an incredibly essential part of online marketing strategies. Tracking and analyzing your social media performance is the only way to understand your social efforts accomplishments.
According to Forrester Consulting and Google’s research, half of the marketers around the globe find it challenging to manage loads of data.
It can be confusing to figure out the key metrics that matter or KPIs to use in reporting. To ensure your social media reports are detailed and accurate, it’s crucial to find tools that prove your social media marketing value.
In this article, I’ll guide you on how to report on social media, what you should include in your report and the best practices for creating your social media report. Let’s get started.
What is a social media report?
A social media report is an internal reporting document that tracks and presents information about the overall performance of social media activities.
Simply put, it’s a smart and easy-to-understand document that proves the value of your social media activities.
It can be anything from a list of numbers in an excel spreadsheet to a stylish slide presentation with detailed analyses.
If done accurately, a social media report can steer your business in the right direction for future campaigns. With it, you get to understand what’s not resonating with your audience so you can stop or pause your campaigns.
Depending on the purpose of your report and target audience, you will need various reports that suit your goals and audience.
What should your social media report include?
The wealth of information and insights in your reporting makes for proactive and useful information. There are a few elements that should not be missed in any social media report. First, you’ll need an outline of your social media strategy that helps your readers understand what’s included in the report. Afterward, you need to include the following key elements.
Goals and targets
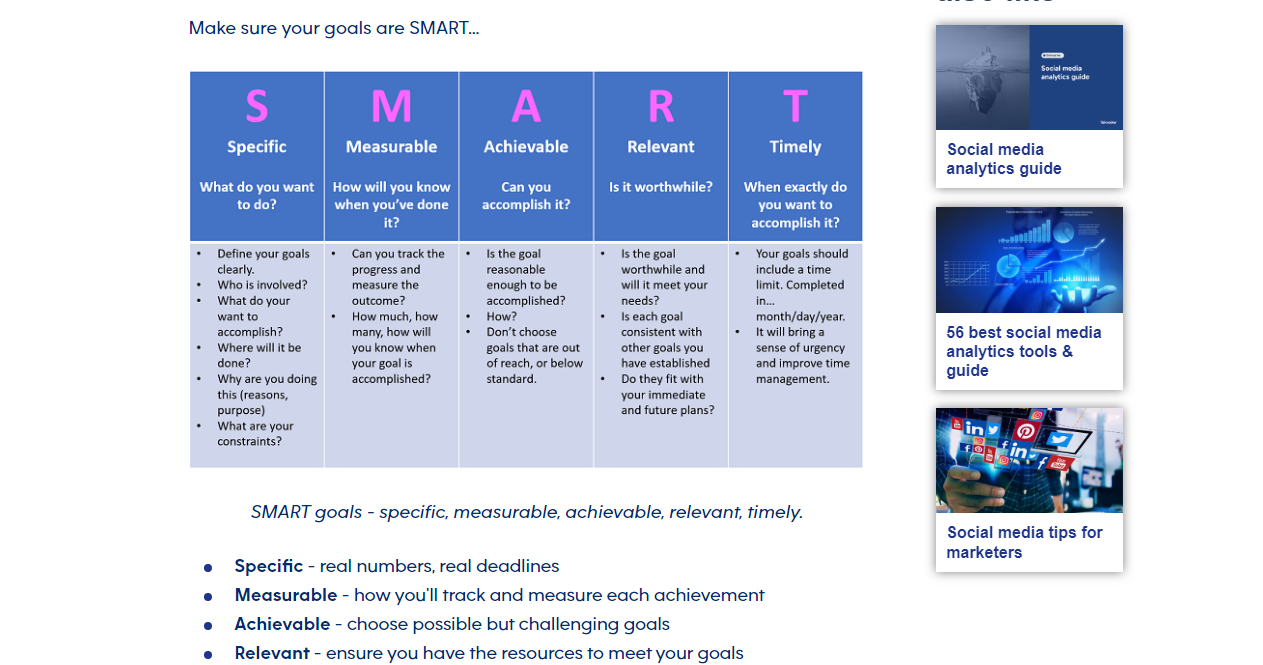
The topmost primary element in any social media report is having comprehensive and measurable goals and targets. This element represents the journey that you’ll take to reach the final objective. Follow the SMART goal-setting framework so you can create goals and targets that are easy to track and report.
Content metrics
Now it’s time to think about the data you’ll measure and report to validate your goals. Remember that SMART goals have built-in metrics. For example, if your Q2 goal is to increase the number of leads generated by 20%, then report the number of leads generated. While metrics vary from team to team, the basic metrics that you should include in the report are:
- Number of leads generated
- Total revenue generated
- Number of conversions
- Return on Investment(ROI)
- Total spent on social ads
- Social sentiments
Results per network
Now, find specific results for each social media channel. The most common data to include for each social media platform include
- Net follower growth or loss
- Number of posts
- Click-through rate
- Engagement rate
- Top performing post(s)
- Top follower
- Top mention
Pro tip: If you’re creating weekly, monthly or annual reports, offer comparisons for similar projects to know the ongoing trends. For instance, compare 2022 Q2 results with 2021 Q2 results.
Wins and fails
Having presented your data accurately, now it’s time to analyze it. Highlight what worked and what didn’t work. Start with the numbers then look beyond the numbers. Maybe you had compelling reviews or had contact with social media influencers. Determine how you got the results and which strategies failed.
Opportunities
Did you discover new opportunities when analyzing your data? Probably, you discovered them through interaction with your followers or through social listening. Is there a specific content, product, or service that your followers prefer? This way you can give your clients a personalized experience and improve your customer service and engagement.
Customer demographics
Knowing your target audience is an essential element for your social media reporting. Understand the language they speak, gender, age ranges, and location so that you segment them and offer targeted campaigns that match their preferences.
Summary
End your report by including a summary of what you achieved, what failed, and what you’ve learned. Include how you’ll use the results to improve your future social media strategies. Focus on the big takeaways to guide your future planning.
Best practices for creating your social media report
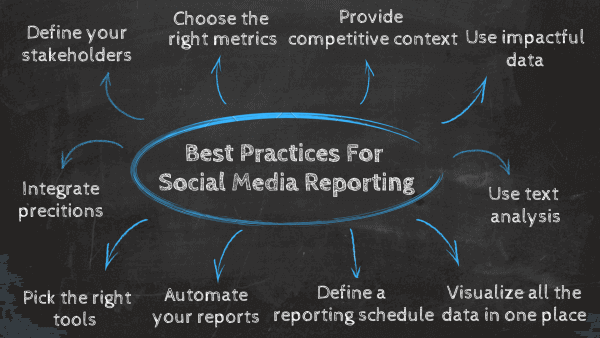
There is no single black-and-white method of creating a social media report, particularly when you’re managing multiple social media accounts. The reporting practices depend on the metrics that you want to track. When it comes to creating a social media report, there are key practices to consider and they include:
- Define your stakeholders. Who are you addressing the report to? Social media is a versatile tool, hence you need to account for reports from different departments. Ensure you create specific reports that are relevant to each stakeholder.
- Determine your relevant metrics. Considering your goals and objectives, choose the metrics that you should add to your report.
- Provide competitive context. Your social media report should not only talk about you. The best practice is to include your competitor’s information such as what works for them the most.
- Visualize your data in one place to create more engaging reports. Use data visualization like infographics, for example, to simplify your data analytics. The amount and diversity of information generated by your social media activities can be significant if you use different platforms.
- Automate your reports. Use automated reporting technologies to schedule your reports so you don’t need to manually send them.
- Select the right social media reporting tools. Choose the best data reporting tool like Whatagraph to present your information. Ensure you select a tool that lets you access real-time data and create powerful and interactive reports.
How to create automated social media reports?
A well-crafted social media report should be easy to understand and detailed. Here is a step-by-step guide to creating automated social media reports.
Step 1: Identify your audience
Is the report meant for your marketing team or your boss? Or, is it just for you? Determining your audience helps you share what’s relevant for that particular audience.
Step 2: Focus on your reporting. Your reporting should focus on the relevant metrics and social media KPIs that matter most for your business.
Step 3: Gather your data. Collect your data from different sources and gather it into one. You can collect data from Twitter, Facebook, Instagram, Linkedin, Tiktok, and other social media platforms.
Step 4: Analyse your data. Perform a thorough data analysis and look for trends, inconsistencies, and other patterns that can help you know what’s working and what’s not.
Step 5: Present your findings. Prepare a clear, concise, and easy-to-understand document to present your data. This document is your social media report.
Bonus tip: Use a social media management tool to fetch in-depth analytics and reports.
You can read more about how reporting can be a game changer here.
The Bottom Line
Whether you’re presenting your social media report to your boss, client, or marketing department, setting SMART goals and tracking the metrics is critical to getting a clear picture of your social accounts’ performance.
With a well-created report on social media activities, you’ll tap into presented insights and make informed decisions about your future social media strategies.
By using the latest social media management and reporting tools you can save your time, and resources and get real-time social media esports.
Which other ways do you use to create your social media reports? We would like to hear from you.