
Picture this: You’re a social media manager. You’ve had a week of manic campaigning. You conceptualized, you created, you published. You think it was a success. You’d like to believe it was a success. But how do you know for sure?
You don’t want all your hard work, your blood, sweat, and tears, to go to waste. It has to have made some difference to the business. You want to be able to show off and be proud of it.
Enter Social Media Reporting and Analytics!
When you’re able to make reports of ongoing or completed projects or campaigns and analyze, you’ll be able to see how much your hard work has affected the business and whether that change is a positive or negative one.

As important as this is for business growth, many times people confuse the two and end up using them the wrong way. This means that they never use the tools to their full potential. It is very important to understand the difference between the two so that you can use them to get great insights and grow your business.
With reporting, you can get a lot of information on how your campaign/project performed. And with analyzing, you can see what tactics are not working and drop them and improve what’s working for your business.
Here below, I’ll explain the difference between Reporting and Analytics.
Reporting
Social listening, as I’ve mentioned here, is a very important tool to have. The data you receive from the listening tool will help you create reports to analyze the performance of your project.
This data will be raw, some of it will be false data or useless data. Reporting helps you pick out the details that will be useful to you and your brand.
These reports depend on the parameters you set. The parameters will be defined based on the goal you’re trying to achieve. Let’s say for example your goal for a particular project was getting engagement from your audience. The parameters you should set here would be the number of likes, comments, and shares.
Tools like Crowdfire offer to create reports for you on their paid plans.
Their reporting feature is located under the Analytics tab on their app. Here you can build reports by selecting the different parameters you want to analyze. Once you enter your Brand name, Project name and, Project description, you can begin building your report.
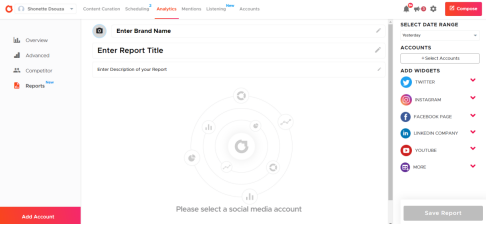
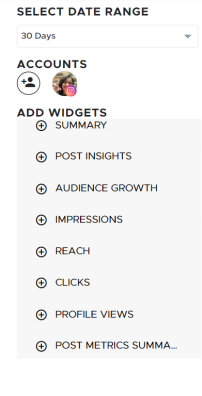
You will need to select a date range. Crowdfire allows you to choose between the options of yesterday, the last 7 days, the last 30 days, the last 90 days, and a custom option.
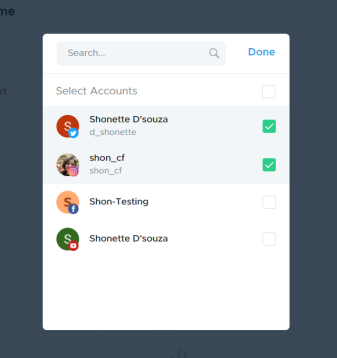
Once you’ve selected the range, you have to select the accounts that need to be included in the report. You can select all the accounts or only the specific ones that you require.
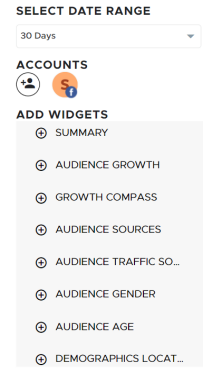
After that, you select the widgets that you need as part of the report. These are the metrics or parameters that will be included in the report. The metrics all differ based on the social account selected. Here you can see a few metrics for Twitter, Instagram, and Facebook.
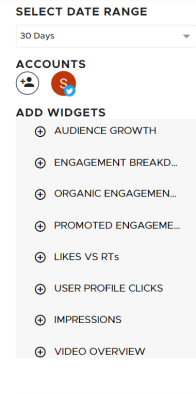
As you select your widgets or metrics, they’ll show up in the center of the page like this.
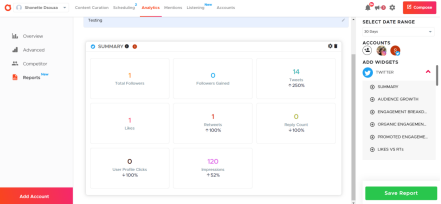
Once all the necessary widgets are selected, you can click on Save Report from the bottom right-hand corner. Here you’ll get the options to Download, Save or Schedule the report. There are 2 options for download; you can get it as a PDF file or a PPT.
Analytics
Once you have your reports, you can get your business analyst or your strategist to have a look at them, analyze the results and suggest your next move.
OR
If it’s just you and your homegrown brand, you can go back to Crowdfire and study the Analytics (or Advanced Analytics depending on your subscription plan) and make smart decisions for yourself.
On the Advanced Analytics Tab, you’ll be able to get an overview of each of your social accounts. You can select the account and then your date ranges from options like yesterday, 7days, 30 days, 90 days, and of course, a custom date range. And then you can customize metrics here too and download reports in the form of a PDF file, a PPT, or a CSV file. The metrics here also differ between social accounts.
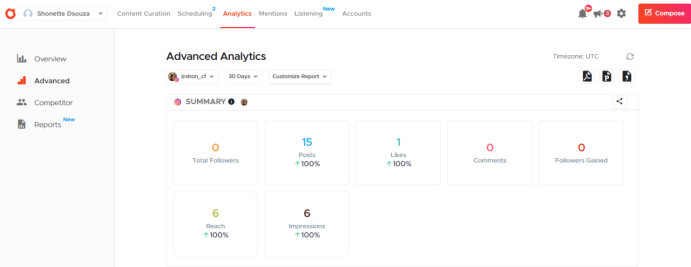
For instance, if you’ve selected Twitter, you’ll be able to get things like Engagement Breakdown, Impressions, Top Posts, Post Types, etc.
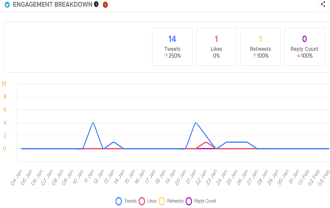
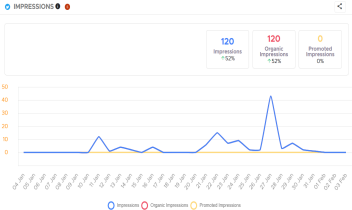
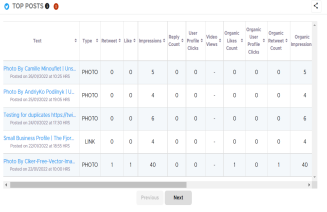
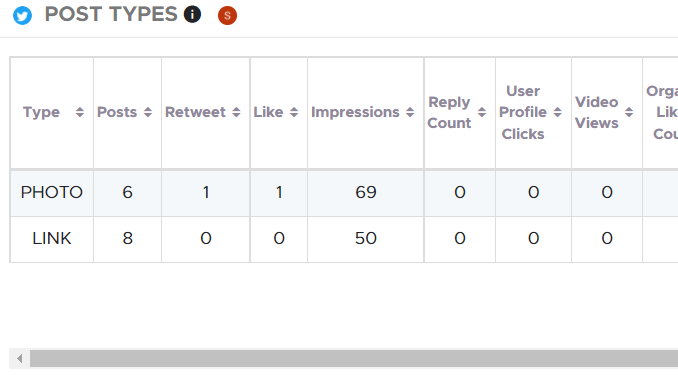
The Engagement Breakdown will give you data about the number of Tweets and the likes and retweets you got. It will also give you your Reply count. Impressions will show you the difference between Organic Impressions and Promoted Impressions. Top Posts will give you a break-up of which posts had how many likes, retweets, impressions, etc. each post received. The Post Types will show you how well a Photo Post is doing as compared to a Link or a Video.
This data will help you understand what you need to improve, be it the kind of content you put out or how often you publish. This may look intimidating if you don’t have any background or experience in Analytics but trust me, it’s super easy to use.
Competitor Analysis
Crowdfire also offers Competitor Analysis for Facebook. Here you have to select the Facebook page you have connected with Crowdfire, if you have more than one connected. The date ranges here are for the last 24 hours, the last 7 days, and the last 30 days. The metrics here are constant and cannot be changed. They include total page likes, posts from the last 7 days, posts from 7 days previous to that, total engagement in the last 7 days, total engagement in the last 7 days previous to that, and top posts.
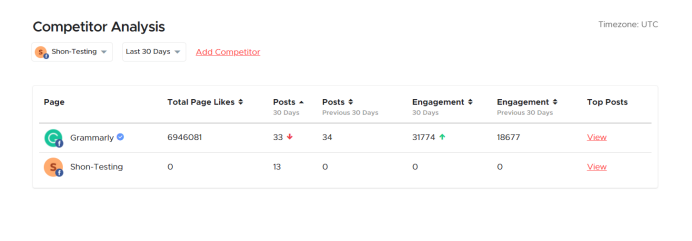
You can add your Competitors by clicking on the red ‘Add Competitor’ Be sure to use the correct spelling and select the correct page from the suggestions that you see. Once you add 1 or more Competitors, you’ll be able to see where you stand. You’ll get an idea of where you’re doing good and where you’ll need to step up. You can also view their top posts to understand why that post is their top post. This will help you rethink the kind of content you put out; you can switch it up to see what works best for you and your audience.
Competitor Analysis is only available on the Premium, VIP, and Business Plans.
Understanding the difference between reporting and analysis can be the tipping point in your social media presence. Once you get the hang of analyzing your data, you’ll find yourself improving your strategy faster than you would if you hadn’t been analyzing your social presence.
If you already use Crowdfire let me know how it’s helped you in the comments below!