

YouTube is the second largest search engine on the web. The platform is a great way to identify, attract, and convert leads and secure customers. If your business doesn’t have a presence on YouTube, you’re losing an opportunity to enhance your bottom line.
Starting a YouTube channel for your business is the first step to accelerating your business growth. The next step is to use YouTube Analytics metrics to assess your marketing efforts. The YouTube analytics dashboard offers you valuable insight into metrics that drive the success of your channel.
This guide will walk you through the eight most critical metrics that should be on your analytic dashboard, how to interpret them in isolation or in combination with other metrics. I will also offer tips on how to maximize the return from each metric.
1. Watch time vs. View Count
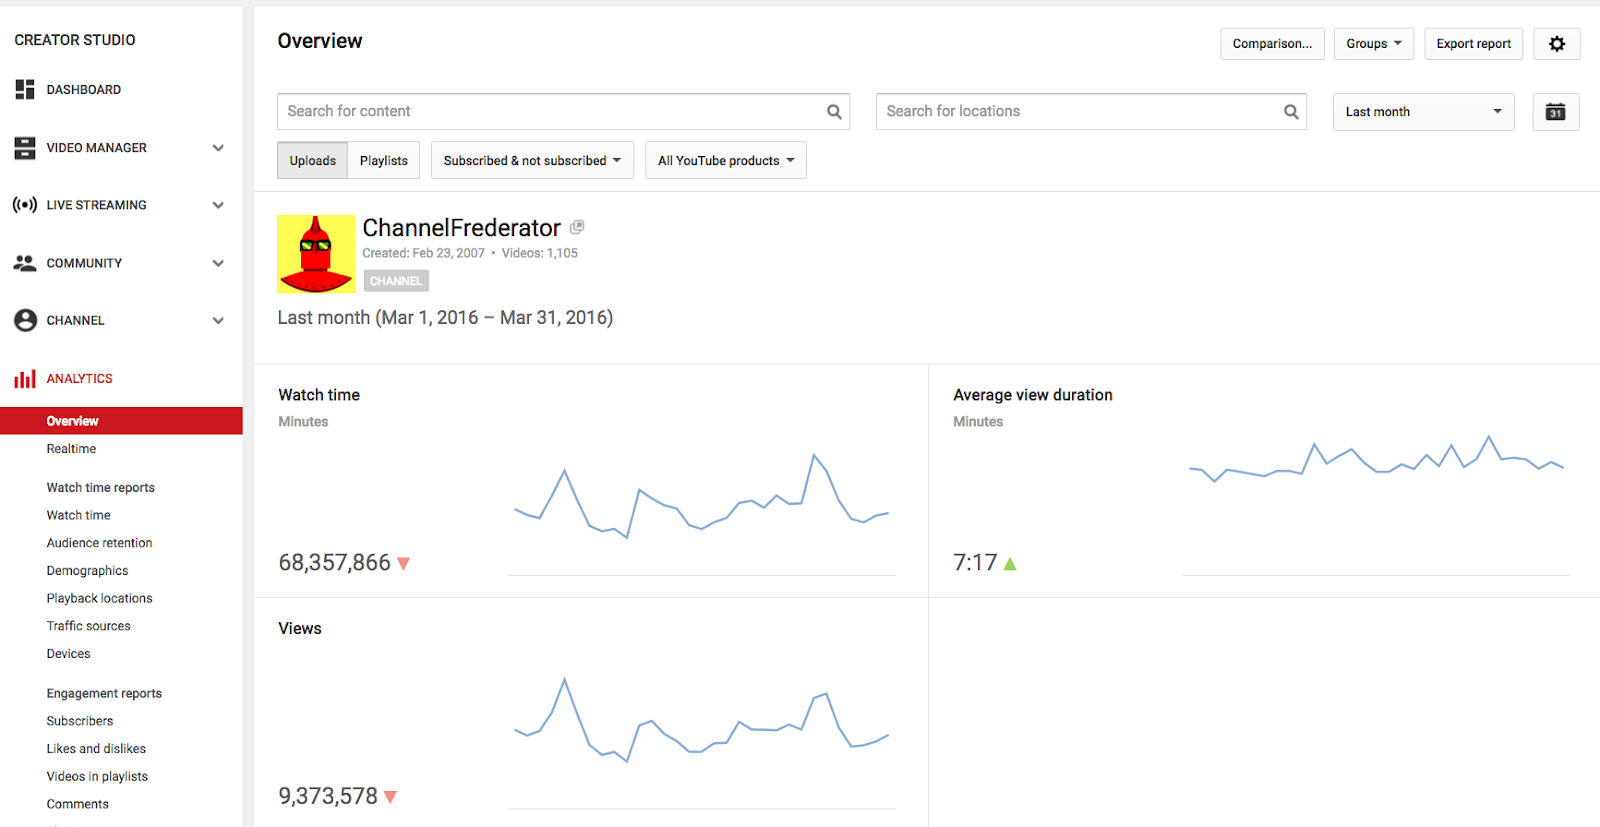
Watch time vs. view count gives you a sense of how engaged viewers are with your content. The YouTube Analytics metric is a measure of the average view time for a video.
A lot of people get caught up with view count numbers. However, view count doesn’t say much and has nominal weight with YouTube’s algorithm. The simple reason is that the view count is easy to game.
Source: Tubefilter
The average watch time is more important.
Watch time is the average time that a user watches videos on your channel or a video. YouTube’s analytics enables you to drill down the watch time based on variables like video theme, length, and styles. It is an essential metric to consider to be a successful YouTuber.
Videos with a high view count but low watch times could point towards issues with your content. Your videos might not be engaging or relevant to your audience. On the other hand, there might be issues with the production quality.
Channels with high watch time are more likely to rank higher in the search results. The YouTube algorithm is more likely to recommend videos from these channels.
2. Audience retention
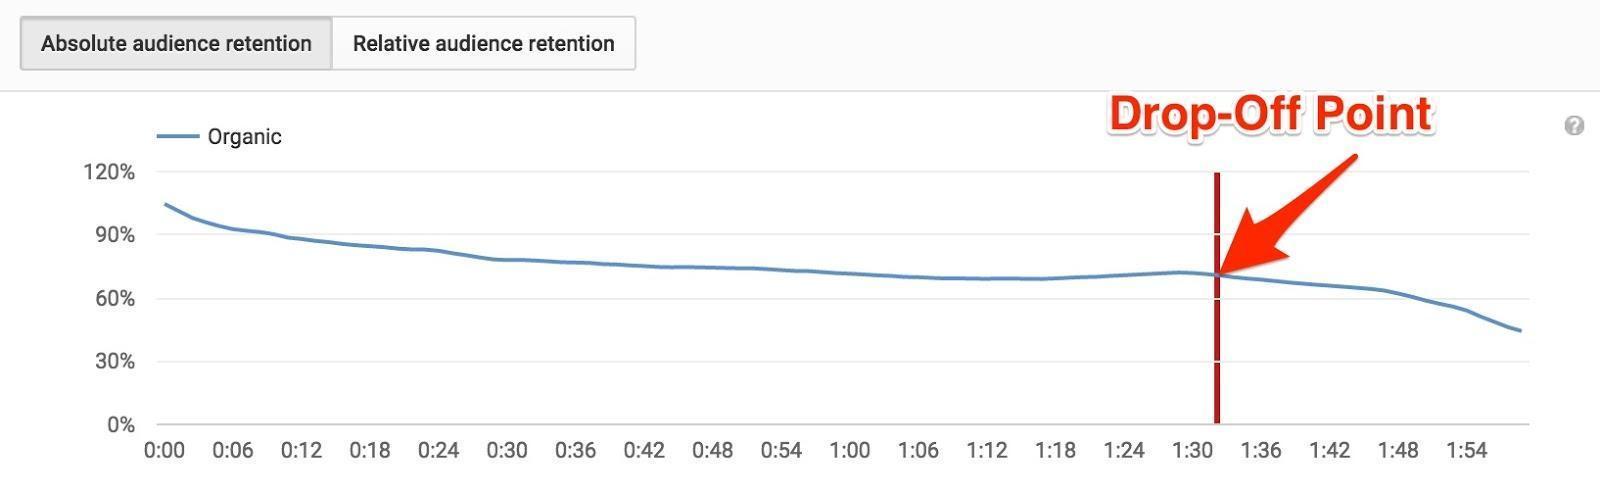
Audience retention is another critical metric to monitor. Audience retention measures the percentage of viewers who watched your video over its length. In simple terms, it measures the drop-off of viewers over the length of the video.
Source: Moz
With the help of the audience retention metric, you can see where the users stop watching your content. In the example shown above, the 2 minute video managed to retain 70% of viewers till the 1:33 mark. Thereafter there was significant viewer decay.
The audience retention page has two tabs for absolute retention and relative retention.
- Absolute retention measures the viewing pattern of a specific video. The graph shows the most engaging parts of your video and the points of disengagement. You can use these insights to take corrective action for your next video.
- Relative retention measures the viewing pattern of your video versus other videos on similar topics and of similar length. You can use these insights to measure your viewer engagement levels against a broader average.
You should analyze your video content, especially videos on online courses, tutorials, and how-tos to figure out what causes people to stop watching your video. You can add ads or a CTA before the major drop-off point.
3. Engagement
The engagement tab on your analytics dashboard measures the interaction level between your viewers and the content on your channel. Engagement levels are based on the following metrics:
- Likes/Dislikes
- Comments
- Shares
- Subscribers Change
To calculate your channel’s YouTube engagement rate, add the total number of likes, dislikes, and comments (for a defined period of time) across all the channel’s videos, and divide this number by your channel’s subscriber count. You can use the data to understand which topics your audience finds most interesting.
4. Impressions click-through rate
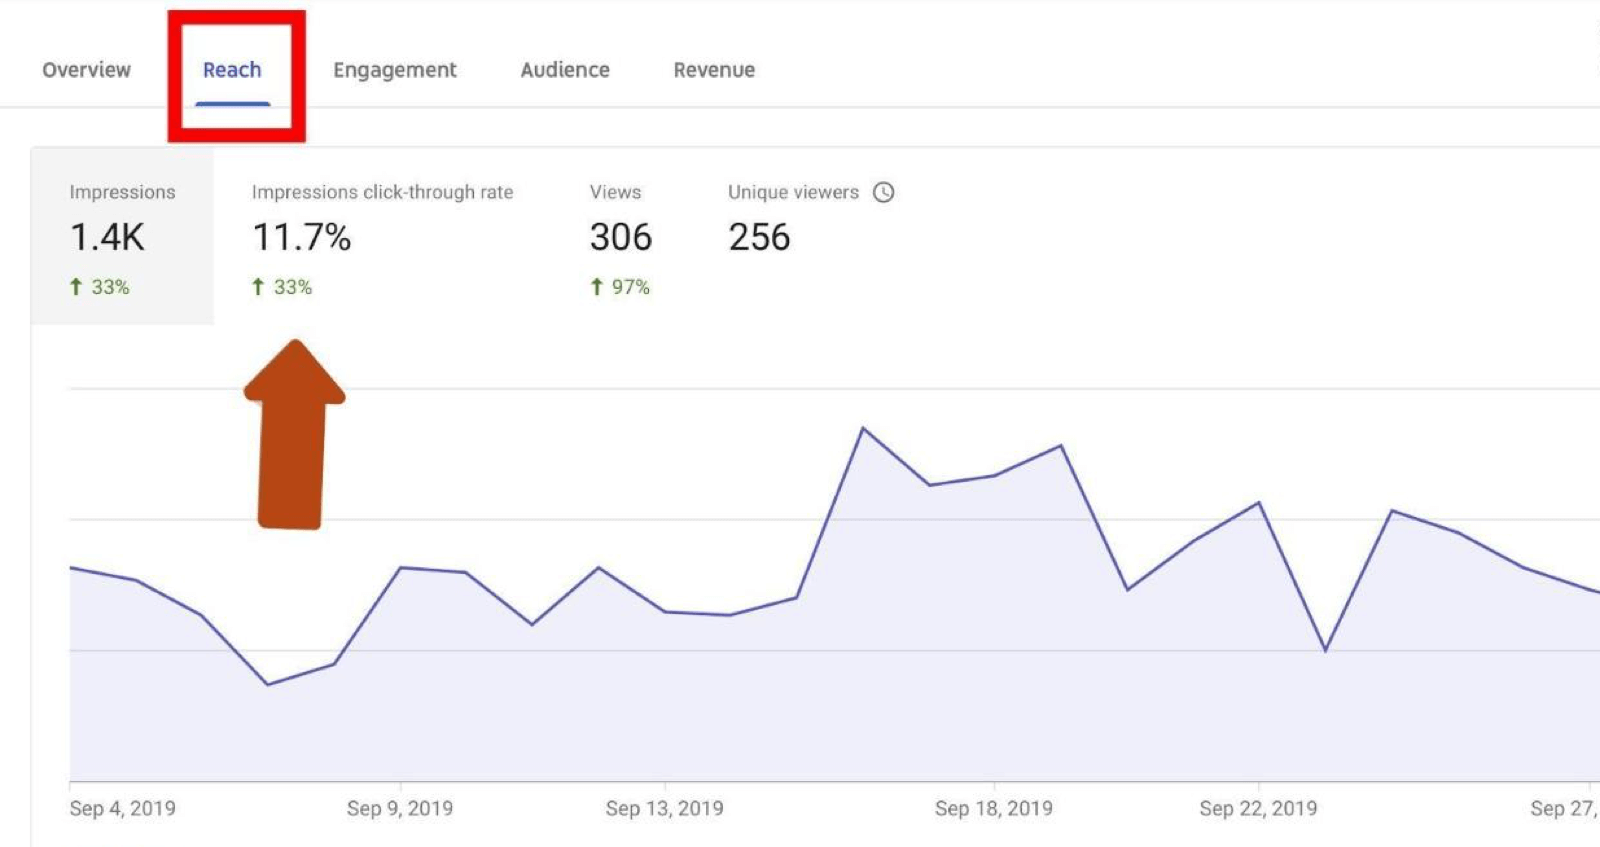
Impressions click-through rate is a helpful metric to understand the reach of your video and the suitability of your video thumbnail. Every time the thumbnail of your video appears on a viewer’s screen, it gets counted as an impression.
The click-through rate allows you to measure how many impressions converted to views.
A card click-through rate is another measure of engagement. Cards are customizable panels that you can place within your videos. They appear in the videos and enable the viewers to interact with the content. The card click-through rate helps you identify which cards people click.
A high impression to click-through rate indicates that your headline and thumbnail are engaging. You want to maximize your impressions click-through rate.
Source: Social Media Examiner
Once you understand the relation between impressions and click-through rates, you can gauge what makes your videos stand out. Use these insights for optimizing your thumbnails and headlines. The practice of optimizing your Youtube channel for clicks is similar to SEO content management.
5. Unique viewers
Unique viewer count is another essential YouTube Analytics Metrics. Suppose a viewer watches your video three times. That would count as three views but only one unique view. Ideally, you want a lot of unique views.
Source: RecurPost
You can use information like unique views to assess how engaged subscribers are with your content. For example, if you have many subscribers but a small number of unique views, you have a low level of subscriber engagement.
6. Demographics report
The demographics report enables you to construct a viewer persona. You can access demographic variables like age, location, and gender. The data helps you to understand and segment your core audience.
Segmenting and targeting your audience will make viewer acquisition easier. You should have a better idea of where to promote your content and what type of content people will find interesting.
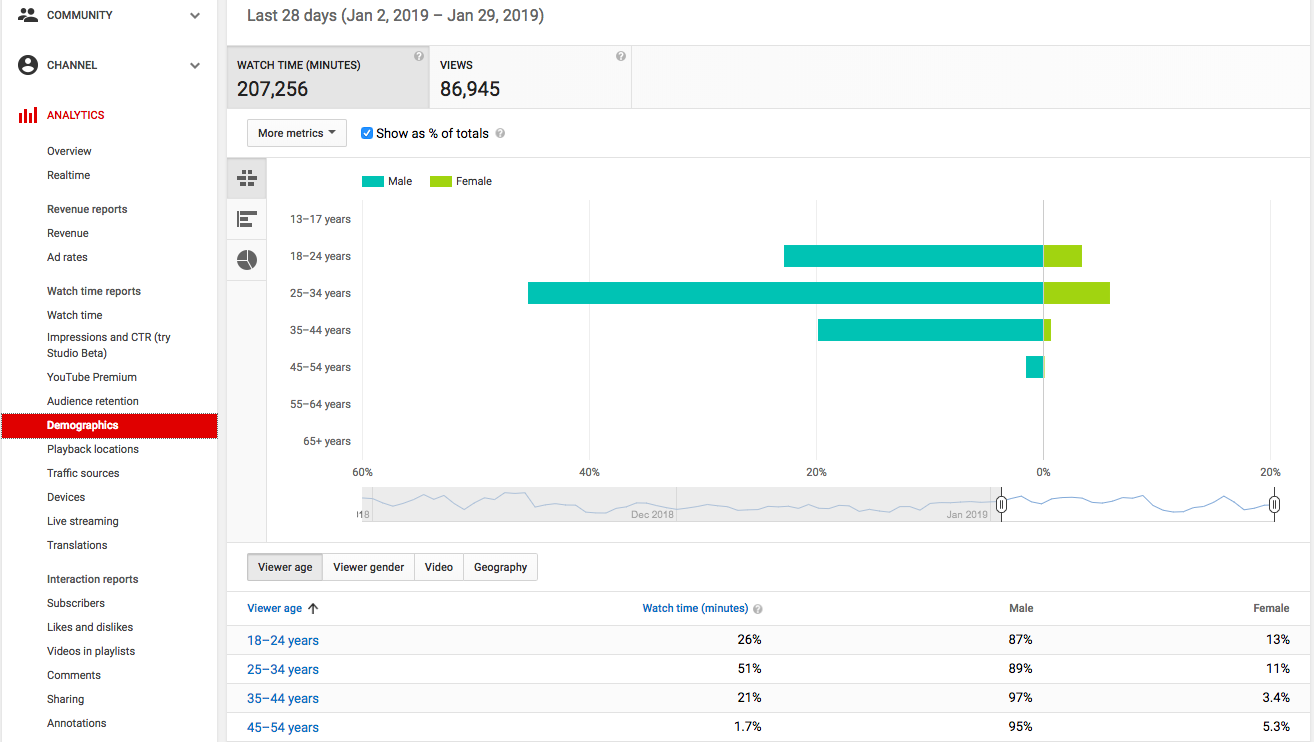
Source: SingleGrain
You can combine audience demographic metrics with geographical source data to build a viewer persona across global markets. That data enables you to create content that matches the interests and needs of your customers.
7. Subscriber growth
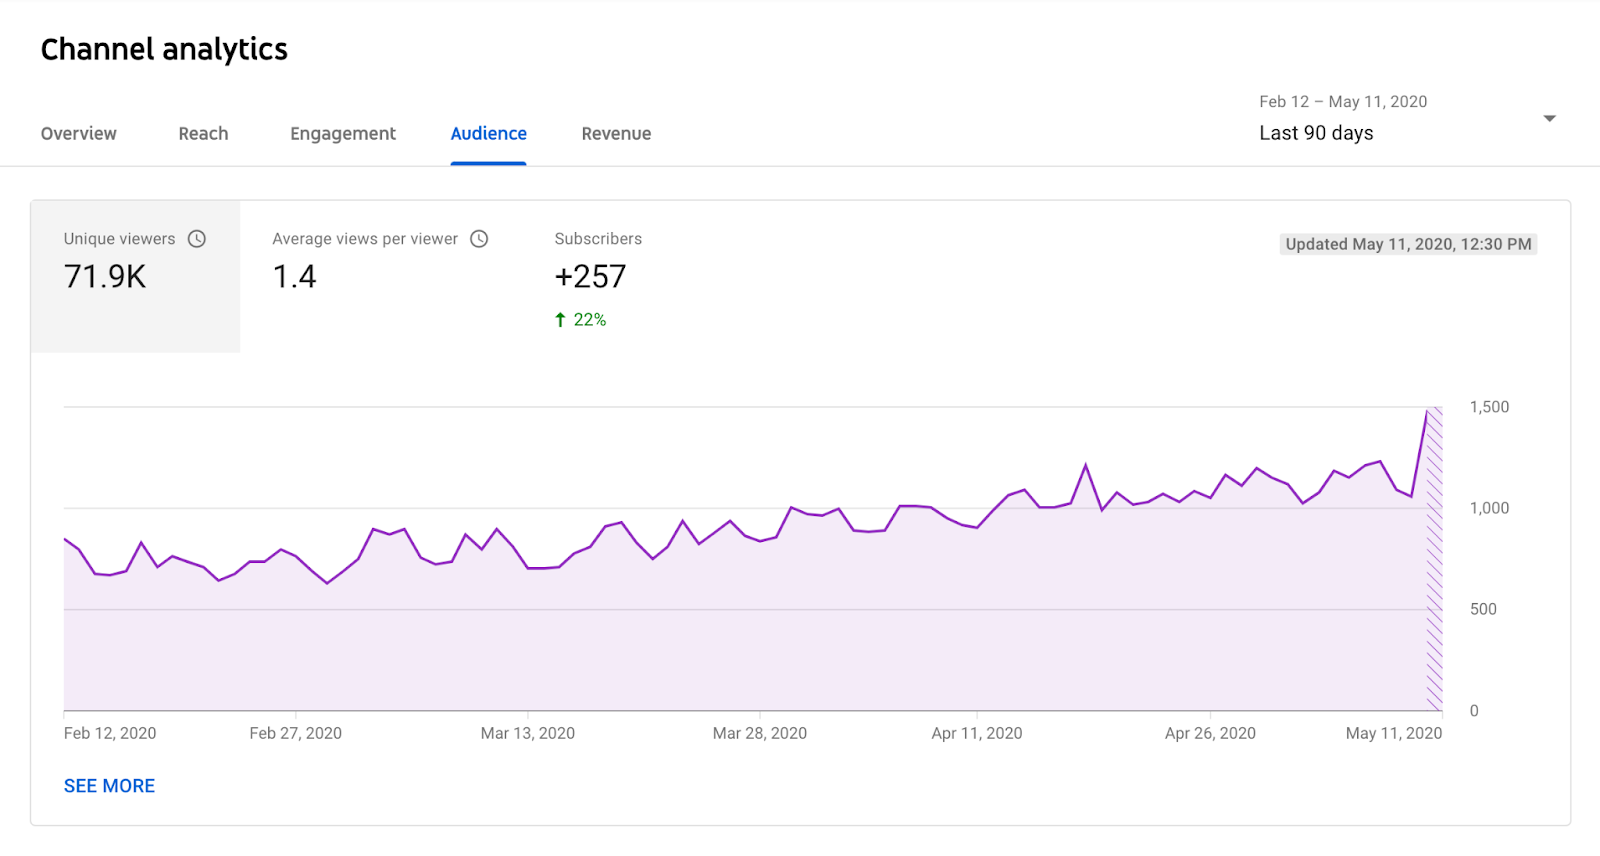
Your subscribers are trusted and loyal fans of your channel and content. Subscribers are your core audience. Every time you release a video, YouTube sends your subscribers a notification. Subscribers are more likely to view your videos.
In general, subscribers connect with your videos more than the non-subscribers. Hence, having more subscribers means you should have more watch time for your videos.

Source: Backlinko
The subscribers report will show which videos resonate well with the subscribers. You can use these insights to target new subscribers. Rapid subscriber acquisition will help you increase video watch time and give you a boost to your search rankings.
8. Traffic source
Analyzing your traffic sources enables you to understand how the viewers found your videos. Traffic source provides you with the referral source and the geographic location of your viewers.

Most of your referrals should come from YouTube. That will either be YouTube search, YouTube Suggest, or your YouTube channel page.
You should closely monitor third-party traffic sources. For example, if you get a lot of referral traffic from social media, it might make sense to increase your presence on that platform. Equally, if you got a lot of traffic from a particular website, you might want to partner with that site.
In Closing
YouTube Analytics Metrics is the most in-depth and comprehensive social media analytics tool. YouTube enables you to reach a large global audience and identify and convert leads into customers.
This guide walked you through eight of the most important YouTube Analytics metrics. Those metrics include watch time vs. view count, audience retention, engagement, unique viewers, demographic information, and more.
Each of these YouTube Analytics metrics provides you with actionable insights that you can use to grow your YouTube channel. Make the most of this data; it’s provided for a reason.
With Crowdfire, you can find curated content, schedule your posts, engage with your audience, deep-dive into analytics and create custom reports. Now introducing Social listening. Try it for free.